5 Ways to Manage Network Complexity with a Network and Application Visibility Portal
Compared to what typical enterprise network architectures looked like a decade or so ago, current global WAN deployments are like a complicated maze and continue to increase in complexity.
What used to be a simple hub and spoke local network has now turned into:
- A complex mesh of globally distributed branch offices
- Numerous data centers
- Multiple network service providers
- A whole range of cloud/SaaS applications
- And even remote and mobile users
All of which is spread across multiple devices and platforms. It’s no surprise then that a study by Enterprise Management Associates (EMA) found that managing network complexity has become the biggest challenge for IT.
In fact, only 15% of network managers reported they are able to oversee cloud networking with existing solutions. Nearly 60% say that they need to attain some new monitoring and troubleshooting tools for their adopted cloud services.
In order to make way for today’s digital transformation, an enterprise WAN needs to be complemented with an intelligent visibility tool, which is a challenge IT faces when using traditional MPLS-based solutions.
Businesses invested in WAN Optimization Controllers (to improve throughput over existing MPLS links) gain some amount of network intelligence and visibility, but this is still only a partial solution.
Standalone add-on solutions could land companies into trouble managing multiple vendors, where interoperability, seamless integration, and unforeseen costs add up to the existing stack of problems for IT teams.
The Fog Lamp for Your Networks
Unlike MPLS and many WAN Optimization vendors, Aryaka offers end-to-end, real-time network visibility and application performance metrics, using the MyAryaka™ web-portal, as part of our fully-managed service.
Network managers get a real-time view of network health through the dashboard, they can address performance issues quickly before productivity is lost.
Here are some of the ways MyAryaka eliminates the challenges usually faced with network and application visibility:
1. Measuring Network Performance
The ability to view network performance and trends proactively helps organizations prevent or be prepared for performance issues or network failures. By monitoring link utilization, traffic patterns, and user/application behavior. Organizations can identify potential ‘choke points’ and apply corrective measures like adding capacity prior to network performance issues or outages.
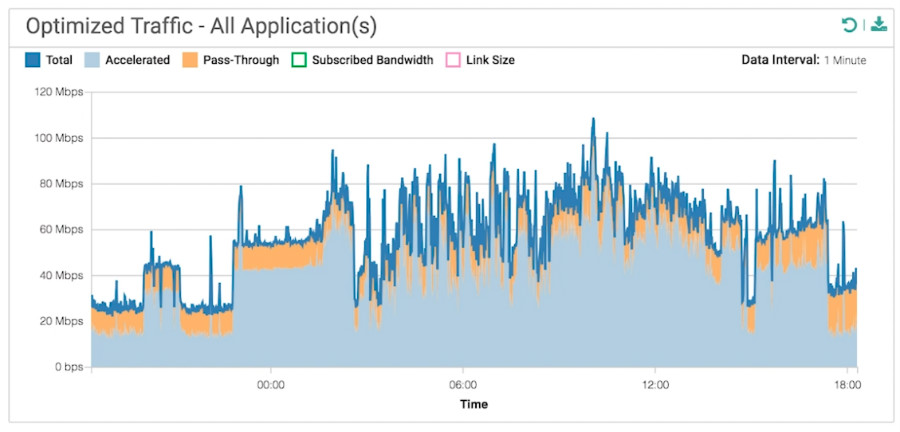
The portal allows network engineers to view the amount of data reduction over the network using compression, data deduplication, and application acceleration proxies. IT teams also gain insight into the performance delivered by Aryaka’s global private network, as compared to legacy technology equivalents.

2. Keeping an Eye on Bandwidth Utilization
The MyArayaka portal provides a granular view of top business apps, latency, traffic and utilization to help IT teams determine how to use existing bandwidth resources in the best possible manner.
For example, when one of Aryaka’s customers noticed that their subscribed bandwidth was getting choked, the MyAryaka portal helped them to look into the top traffic flows over the network and pinpoint the Server IP that was consuming the highest amount of bandwidth. Later, by performing rate-limiting, the network was quickly restored by Aryaka’s customer support.
3. Troubleshooting Network Issues
Having a granular view of network-health is vital to overall network performance. Identifying specific links with high rates of packet loss helps IT teams isolate problems with network performance and resolve it accordingly. Apart from providing this capability, the portal also highlights the geographies where the links have gone down.
The portal helps the network managers and IT teams to not just keep a close watch on the networks but also resolve issues with the click of button. Network managers can move or shift loads, assign bandwidth, or configure their networks on the portal.
4. Simplicity and Accessibility
The ‘Key Highlights’ dashboard on the portal makes it easier for network engineers to pull out reports and dashboards in a high-level overview format that can be tailored for CIOs, IT directors, network managers, or anyone else in your IT organization. In addition, this level of detail is all available on a single visibility platform, even to customers who subscribe to multiple Aryaka services, making it that much easier to gain the full benefits of network and application visibility.

MyAryaka eliminates the need to purchase expensive upgrades, specialized appliances, or third-party monitoring tools, with accessibility across all browsers and to multiple branch users.
5. Enabling a Better Customer Experience
Most solutions offered in the market need to be purchased separately and pile on added costs for an organization. The solutions that are free and included with existing software stacks provide a very basic view to the IT teams. Aryaka’s success can be credited to the comprehensive visibility portal with extensive features that is a part of the Aryaka services and comes at no extra cost.
As networks keep getting more robust, network managers need a visibility and monitoring tool that cut through the layers of complexity and can provide a holistic view of the network health in an easy-to-understand format, enabling problem detection and management.
It is imperative organizations start treating it as less of a ‘plumbing-when-pipes-leak’ tool and more a proactive problem resolution platform.
There is plenty more to talk about MyAryaka and the benefits it can provide for your business. To see for yourself how the portal offers full-scale visibility of corporate networks, continue here to watch this demo, or contact us today to learn more.


